
Place a greenhouse humidity sensor where it can represent the decision it supports, then validate the reading during the actual risk period. A sensor intended to represent the crop should sample a canopy-relevant zone. A sensor intended to diagnose glazing condensation should represent the air near that surface. A control input should represent the air state the equipment is expected to change.
The center of the greenhouse is not automatically the correct location. Sun, heaters, vents, fans, spray, cold surfaces and compartment boundaries can make one point unrepresentative. Plan placement around the measurement task; the sensor selection and calibration guide covers instrument specifications and maintenance.
Define the measurement task first
A sensor location cannot be judged without knowing what decision the reading will support. Start by assigning one primary purpose to each point.
| Measurement task | Representative zone | Decision supported |
|---|---|---|
| Crop-zone condition | Air within or near the active canopy, protected from direct wetting and radiation | Crop-environment review and local humidity trend |
| Condensation diagnosis | Air near the relevant glazing, leaf, pipe, frame or curtain zone | Compare nearby dew point with surface temperature |
| Equipment control input | Air state defined by the equipment and controls design | Staging, stop and alarm logic within the approved interface |
| Return-air reference | Air entering the conditioning device or return path | Equipment inlet condition and response |
| Outdoor reference | Outdoor air at a location that avoids local exhaust and surface effects | Ventilation moisture comparison |
| Zone comparison | Repeated points across crop blocks, levels or compartments | Identify persistent spatial differences |
One sensor may support more than one decision only when its location is representative for each. If that cannot be demonstrated, keep the tasks separate. A crop sensor should not be relabeled as a cold-surface sensor merely because it is convenient to access.
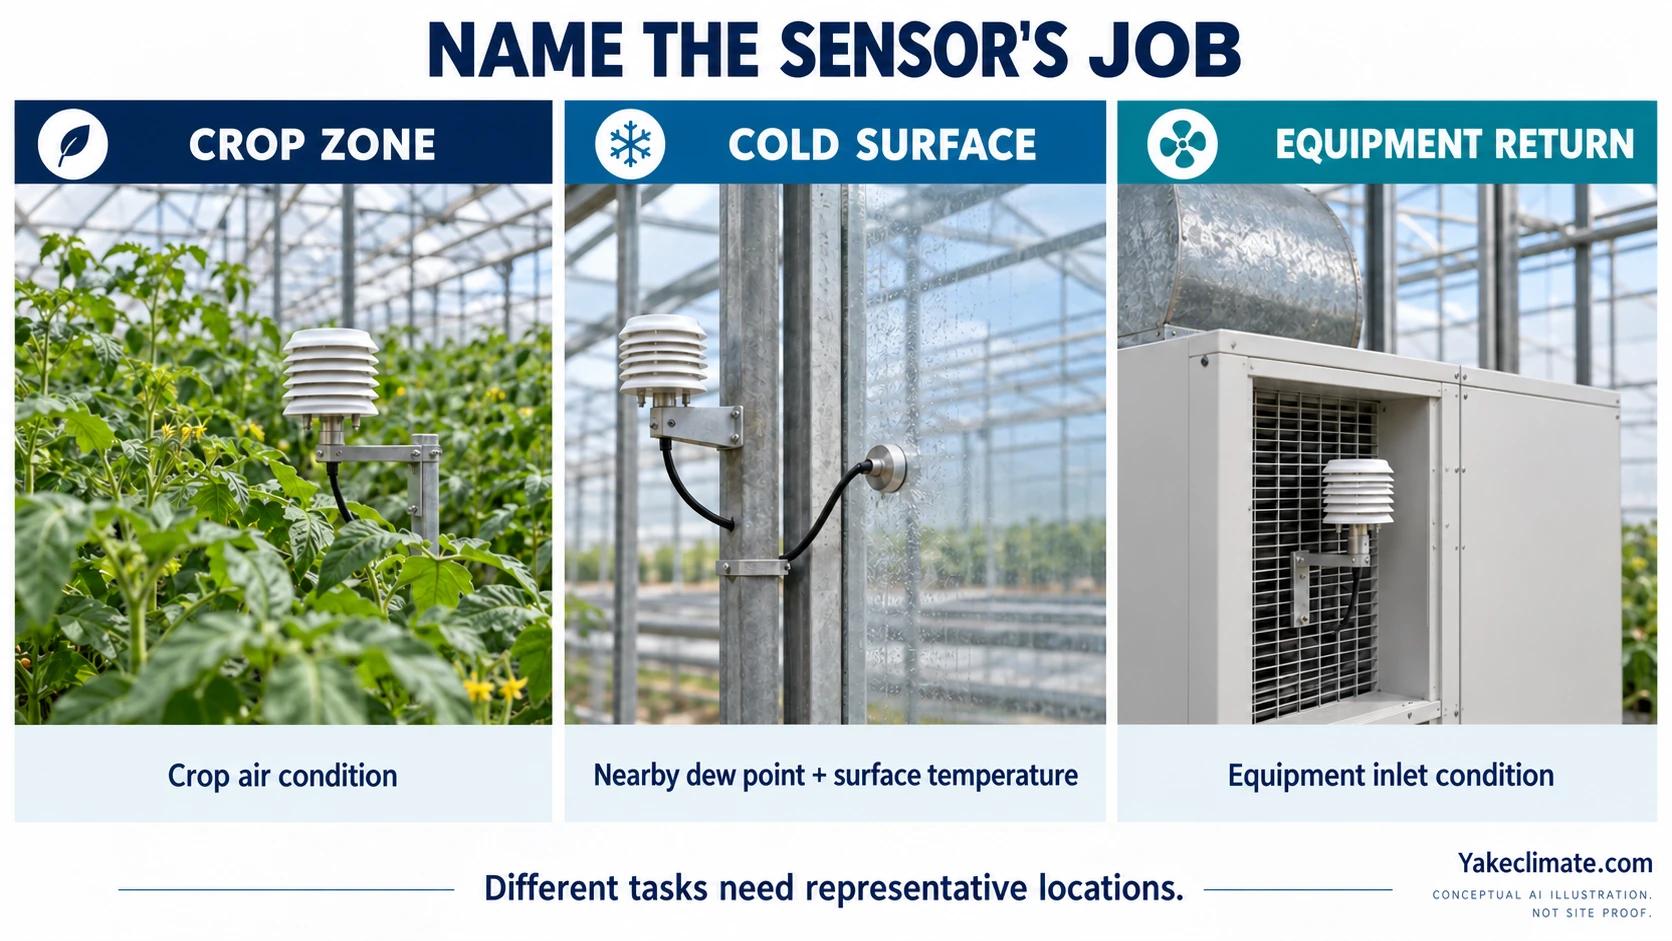
Connect the monitoring plan to the agriculture application overview and the broad greenhouse humidity-control guide so the measurements answer a defined crop, condensation or equipment question.
Choose representative crop and risk zones
The most useful crop-zone point is usually near the height and air volume that represent the active canopy, not above the crop or next to an aisle chosen only for convenience. The location must change as the crop architecture or controlled zone changes.
University of Alaska Fairbanks guidance places greenhouse sensors at plant canopy height with limited direct influence from heaters, vents, fans or drafts. It also calls for shielding from direct sun (UAF Cooperative Extension, Controlling the Greenhouse Environment). That source supports the placement principle, not a universal mounting height or sensor count.
Use the following zone review:
- Map crop blocks and canopy heights. Note different crops, stages, densities and levels.
- Map air paths. Mark supply, return, circulation fans, vents, doors and curtain boundaries.
- Map risk surfaces. Mark glazing, pipes, frames, perimeter areas and recurring wet zones.
- Map heat and radiation sources. Include heaters, direct sun and lighting effects that can bias the instrument.
- Assign permanent and temporary points. Permanent points support ongoing decisions; temporary points test whether those locations are representative.
The number of points must follow the number of meaningful zones, the consequence of a missed event and the required control decision. This article cannot convert greenhouse area into a universal sensor count.
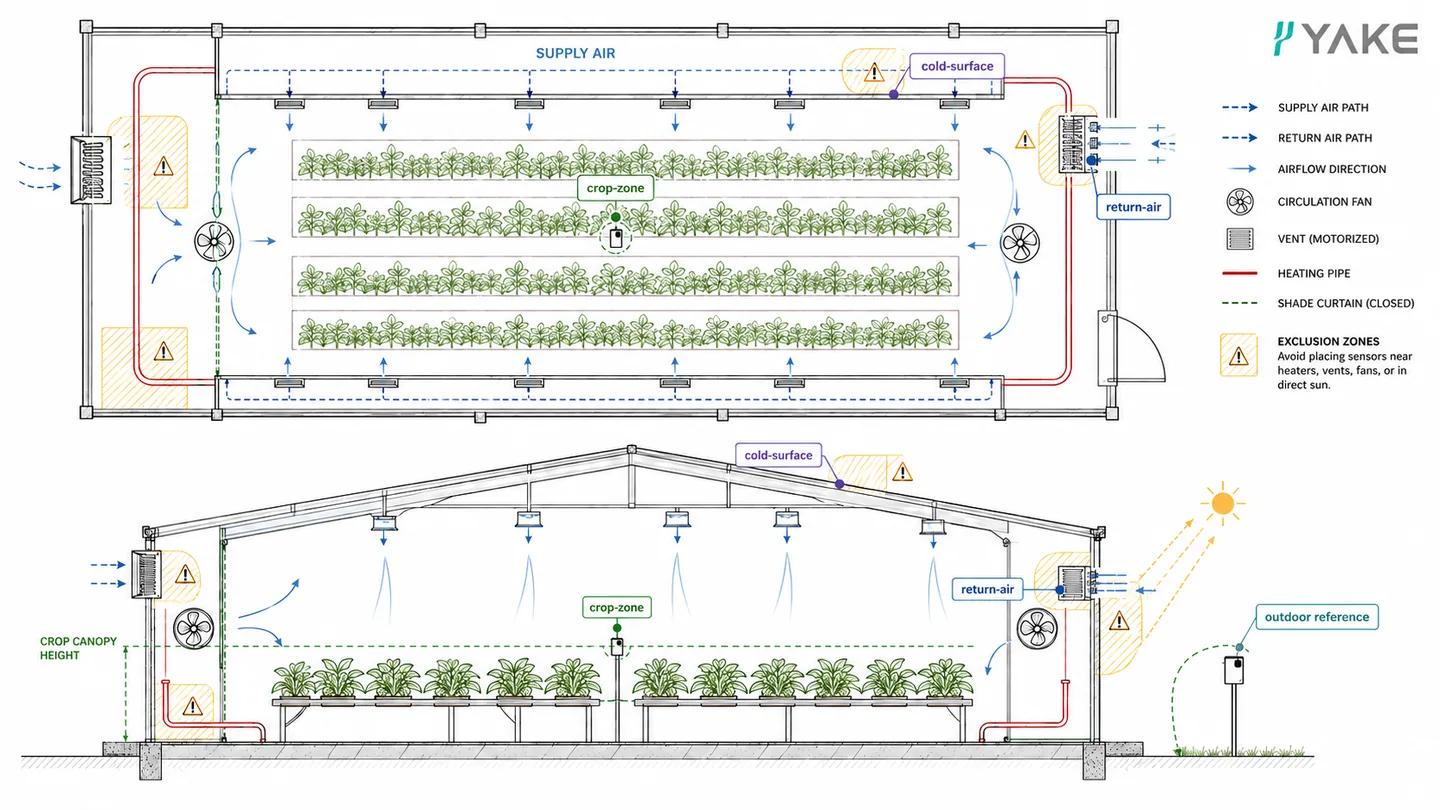
Avoid locations that bias temperature or humidity
A sensor measures the air and thermal environment around the sensor. Direct local effects can therefore make a technically accurate instrument produce data that is wrong for the intended decision.
Review these common bias sources:
- Direct sun or strong radiation: the sensor body or shield can heat above the surrounding air condition.
- Heaters and hot pipes: local sensible heat can lower the reported RH and hide a cooler crop zone.
- Supply air, vents or fans: a draft can make the point represent delivered or outdoor air rather than the mixed zone.
- Fogging, spray or irrigation: direct wetting can saturate or contaminate the sensor and distort recovery.
- Cold glazing, frames or walls: a point too close to a surface may represent the boundary layer rather than the crop zone.
- Doors and leakage paths: intermittent outdoor air can dominate a reading during wind or access events.
- Service locations outside the crop: an accessible aisle or control cabinet may be convenient but irrelevant to the target zone.
Document unavoidable compromises. A point can still be useful if its purpose is named correctly and its relationship to the crop or risk zone has been tested. Do not silently treat a return-air or service-location sensor as a canopy measurement.
University of California observations of nighttime crop condensation show why local temperature and air movement matter near leaves and flowers (UC Agriculture and Natural Resources, Condensation on Leaf and Flower Surfaces). Use the greenhouse condensation guide when the measurement task is to diagnose a wet surface rather than control room-average humidity.
Interpret RH with temperature and dew point
RH changes with temperature, so a humidity reading without its paired temperature can be difficult to interpret. Log both from the same point and timestamp. Where condensation matters, calculate or measure dew point on a documented basis and compare it with a representative surface temperature.
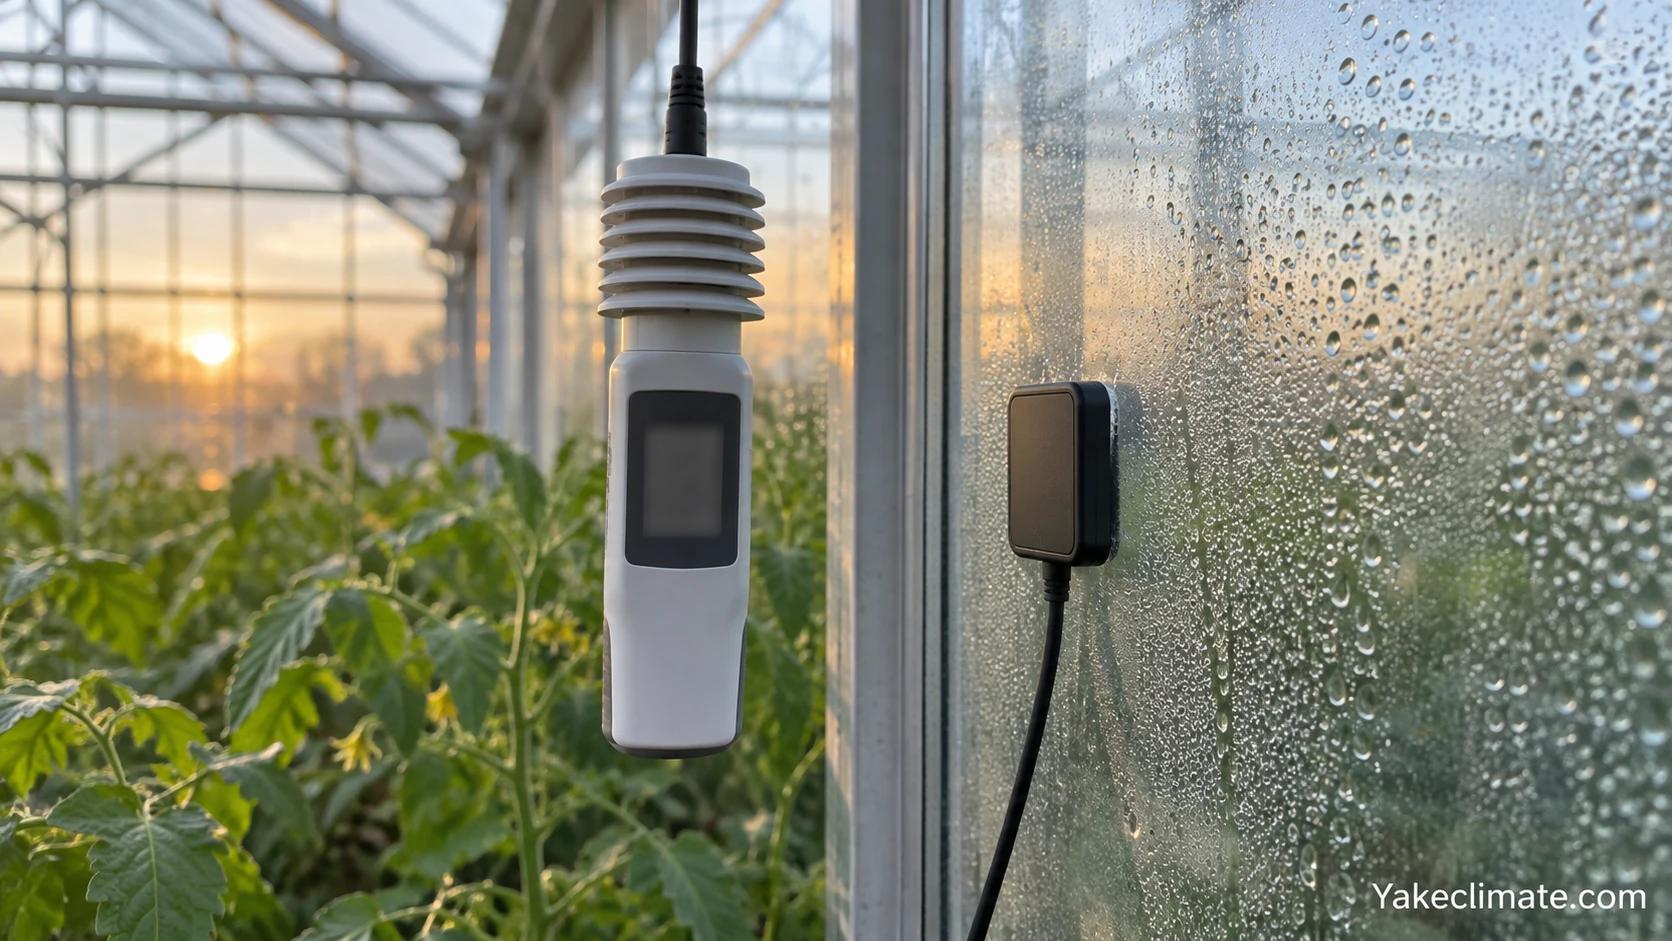
| Variable | What it describes | Placement implication |
|---|---|---|
| Air temperature | Thermal condition at the sensor | Must represent the same zone as RH |
| Relative humidity | Proximity to saturation at that temperature | Cannot be compared across zones without temperature context |
| Dew point | Condensation temperature for the measured air state | Compare with a local surface on the same time and place basis |
| Humidity ratio | Water-vapor content per dry-air basis | Useful for indoor and outdoor moisture comparisons |
| VPD | The project-defined vapor pressure difference. Air VPD can be calculated from air temperature and RH; leaf-to-air VPD also requires a representative leaf temperature | State which VPD definition the project uses; do not infer leaf-to-air VPD from an air sensor alone |
| Surface temperature | Temperature of the actual risk surface | Must be measured or estimated for the identified surface |
The National Weather Service describes dew point through a chilled surface reaching vapor-pressure equilibrium as condensation is detected (NWS, Dew Point/Ambient Temperature Sensor). This supports the dew-point definition, not a greenhouse instrument selection rule.
For crop context, connect monitoring to the plant transpiration reference. State whether the project uses air VPD or leaf-to-air VPD, and document the calculation basis. The grower or agronomist owns crop- and stage-specific targets.
Use the dew point calculator with measured air temperature and relative humidity when interpreting the sensor records.
Validate placement during the real risk period
Validation asks whether a permanent reading follows the condition it is supposed to represent. Perform the comparison during the event that matters, such as sunset, curtain closure, irrigation recovery, a cold night or a ventilation change.
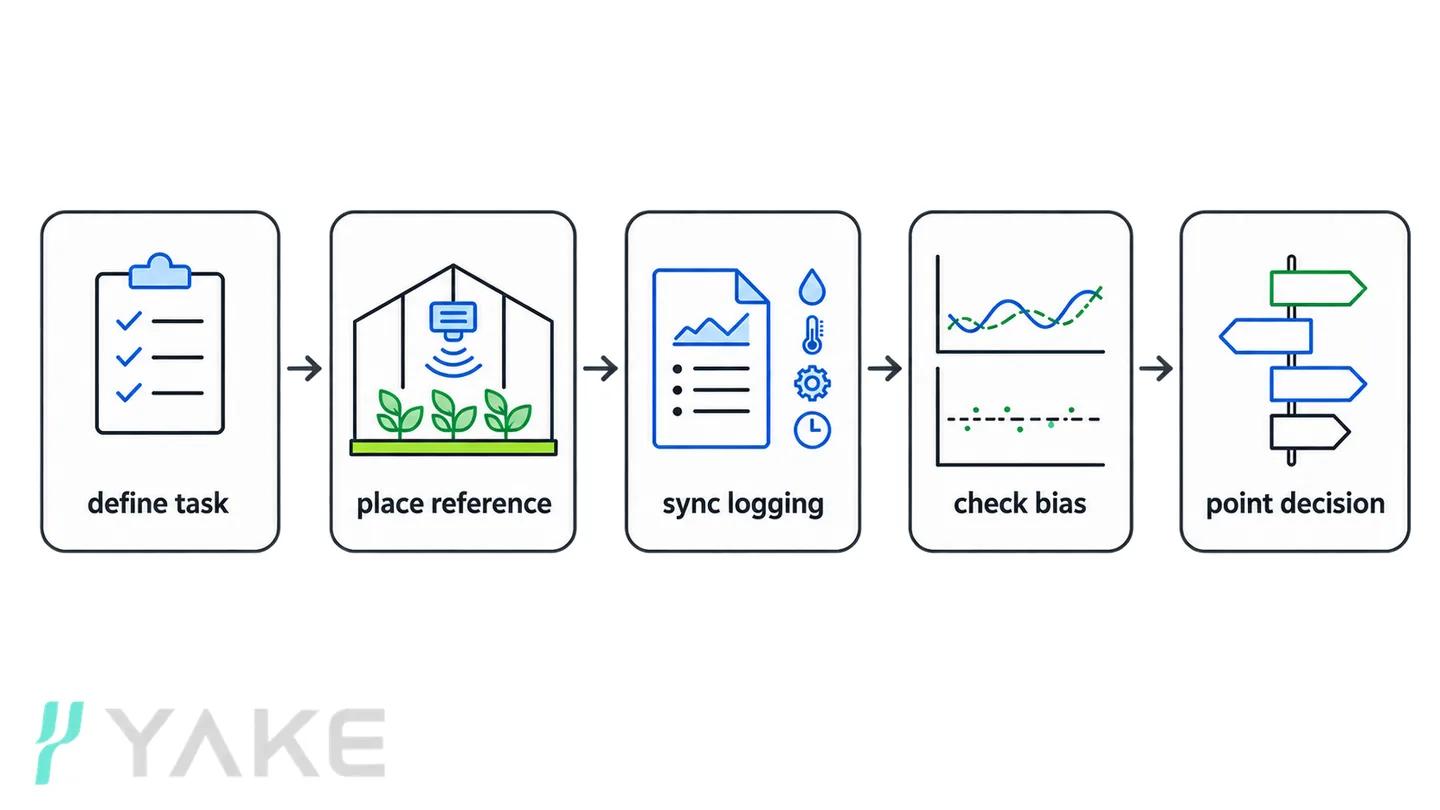
Use this sequence:
- State the decision. Name the crop, surface, control or equipment question.
- Choose a temporary reference. Place it in the relevant crop or risk zone without creating the same known bias as the permanent point.
- Synchronize the observations. Log air temperature and RH with equipment and event states on the same timeline.
- Compare the pattern, not one reading. Look for timing, direction and persistent divergence around the event.
- Investigate the cause. Check radiation, drafts, wetting, height, response, calibration state and a real zone difference.
- Move, rename or add the point. Change the placement or narrow its stated purpose when it does not represent the intended zone.
- Repeat under a comparable event. Do not accept the new location from one convenient daytime observation if the real problem occurs at night.
Do not copy a universal tolerance, comparison duration or logging interval into the plan. Those values depend on the instrument, control task, event duration and project risk. The controls owner should define the acceptance rule and keep the validation record.
Log the events that create humidity risk
Placement and validation are only useful when the recording plan captures the events that create risk. A daily average can hide the periods that drive disease pressure or condensation: irrigation recovery, screen closure, light-off, night fall and pre-dawn are usually where the data matters.
| Event | Data to capture |
|---|---|
| Irrigation ends | How quickly the crop zone recovers from elevated RH |
| Screens or curtains close | Whether the measured point becomes stratified or isolated |
| Sun or lights drop | How fast RH rises before control action or equipment starts |
| Night period | Maximum RH and dew-point margin at the risk surface |
| Pre-dawn | Coldest surface temperature and highest humidity risk |
| Ventilation change | Whether outdoor air removes or adds moisture at the measured point |
Log air temperature, RH, equipment state and event markers from the same timestamp basis so the pattern can be compared with the validation record. NC State Extension lists prolonged high humidity, leaf wetness and dead-air areas as the greenhouse conditions to manage for Botrytis; monitoring should therefore expose duration and location, not only a single peak value (NC State Extension, Botrytis Blight of Greenhouse Ornamentals).
Crop clues to compare with the sensor zone
Compare the sensor record with same-zone observations. These are scouting contexts, not diagnosis or ranking.
| Observation context | Placement question | Interpretation limit |
|---|---|---|
| Tender or injured tissue | Does the sensor represent nearby canopy air? | Air RH does not measure tissue wetness. |
| Flowers, petals or pruning wounds | Is the crop feature inside the monitored zone? | One crop example cannot establish all crop conditions. |
| Dense canopy or low airflow | Is a second point needed to test variation? | One point cannot represent all zones; use linked symptom guidance for diagnosis. |
For crop-response context, see how humidity affects plant growth. Use symptoms to guide further checks rather than as proof that one humidity reading explains the cause.
(UConn Extension) (NC State Extension) (NC State Extension)
Keep the sensor’s represented air zone distinct from the observed crop or tissue location; unresolved crop interpretation goes to the crop lead.
The recording interval, alarm thresholds and comparison duration are project decisions defined by the instrument, control task, event duration and risk consequence. This guide does not publish a universal logging interval.
Keep placement separate from sensor selection and calibration
Placement, product selection and calibration are related but distinct tasks:
- Placement asks whether the point represents the intended zone.
- Selection asks whether the instrument range, response, protection and output fit the task.
- Calibration or comparison asks whether the instrument reading remains credible against a defined reference.
NIST calibration services cover relative humidity sensors and dew/frost-point instruments using known moisture conditions. The service also reports calibration uncertainty (NIST, Hygrometers). That metrology context shows why accuracy must have a reference and uncertainty basis. It does not set a field calibration interval or tolerance for every greenhouse sensor.
Use the greenhouse sensor selection and calibration guide to define instrument specifications, comparison methods and maintenance responsibilities.
Use placement data in control and equipment review
A control signal should represent the zone the controlled action is intended to change. Before using a permanent sensor for dehumidifier staging or equipment evaluation, confirm:
- the signal's named zone and purpose;
- its relationship to the crop or condensation risk zone;
- the inlet or return air state the equipment actually sees;
- the airflow path between treated air and the target zone;
- event timing, control-state logs and disturbance recovery;
- the controller interface, alarm behavior and sensor-failure response;
- who owns sensor zoning, calibration and control-sequence decisions.
Wageningen research notes that humidity around greenhouse crops can be spatially non-uniform and that air distribution affects practical humidity control (Campen, Dehumidification of Greenhouses). A clean trend from one unrepresentative point cannot prove that the crop or cold surface is controlled.
Common patterns and the decisions they support
After validating a signal and its represented zone, compare the trend with equipment states and operating events. Use the patterns below to choose the next check, then have the responsible controls or crop owner assess any proposed change:
| Observed pattern | Check before changing equipment or controls |
|---|---|
| Humidity rises before night | Compare local air/surface temperature, moisture events, screen state and approved sequence; verify sensor representation. |
| One zone remains wetter | Check placement, airflow paths, crop density and supply balance before attributing difference to capacity. |
| Ventilation does not lower humidity | Compare indoor/outdoor humidity ratio on the same pressure/time basis, then confirm permitted airflow and representation. |
| Dehumidifier short-cycles | Check whether the reading represents the controlled zone; route equipment tuning to the commissioning page. |
| RH remains high after irrigation | Check temperature, water input, sensor position, airflow and equipment response before changing a setpoint. |
The controls and agronomy teams define the acceptance rule and record the decision; the equipment manufacturer confirms the accepted input and interface requirements.
For handover, connect this plan to the greenhouse humidity-control commissioning checklist and the greenhouse project design-data checklist. Record which signals support sizing, control, alarms and acceptance. Do not treat every sensor as interchangeable.
Use the validated operating data when comparing greenhouse dehumidifier models for the project.
FAQ
Frequently asked questions
How high should a greenhouse humidity sensor be?
Place a crop sensor at a canopy-relevant height for the crop and stage it is intended to represent. There is no universal mounting height for every greenhouse. Reassess the location when the canopy or production layout changes.
Should a humidity sensor be placed near a circulation fan?
Avoid a point where the fan's direct draft dominates the reading unless the intended task is to measure that air stream. A crop-zone sensor should represent the mixed crop environment rather than the fan discharge.
Is one humidity sensor enough for a greenhouse?
It may be enough only if one point has been shown to represent the relevant crop, surface and control zone. Long bays, compartments, different crop blocks, curtain zones or recurring wet areas usually require comparison points before that assumption can be accepted.
Should greenhouse control use RH, dew point, or VPD?
The choice depends on the decision. RH is tied to the current air temperature. Dew point is useful for comparing air with a cold surface. Crop management may use air VPD or leaf-to-air VPD, but the latter also requires a representative leaf temperature. The controls and agronomy teams should define the variable and calculation basis, while the equipment manufacturer confirms accepted input and interface requirements.
How often should greenhouse humidity data be logged?
Choose a recording interval that can show the relevant irrigation, screen or temperature transition, accounting for instrument response, event duration and the decision being made. Verify the choice with a trial record rather than applying one interval to every event.
Approve the signal before connecting it to control
Greenhouse humidity data is useful only when the sensor represents the decision zone. Define the task, place the point away from known bias, pair RH with temperature and validate the signal during the actual risk period before using it for control or equipment evaluation.
For an equipment-fit review, submit the approved sensor zones, logged air states and interface requirements with the wider project inputs.
Related technical reading
For the evidence behind spatial comparisons, see uneven crop humidity zones. A crop-specific question such as tomato pollination also needs the conditions experienced by the relevant flowers; a remote air reading alone does not establish that exposure.


